I had been wanting to better understand the geographical characteristics of race and ethnicity in the San Francisco/Bay Area region where I reside. The US Census has plenty of updated information on this topic, and Uber recently released Kepler.gl, an in-browser application to visualize maps. With both of these, it was relatively easy to build this interactive map.
By default, you are seeing the majoritarian race that populates each census block (geographical areas containing anywhere from 2,000 to 8,000 people). I grabbed the data from the American Community Survey in its most recent 2017 version. Note that the US Census recognizes 5 different races: White, Asian, African, Pacific Islander, and Native American, and 2 ethnicities: hispanic or non-hispanic.
In my humble opinion, the way the races and ethnicities are classified in this survey could use some work. So, for my visualization, I combined all self-reported hispanics regardless of their reported race and made up a new race “hispanic” with these individuals. For consistency, results for other races only account for individuals that also self-reported their ethnicity as non-hispanic.
A few notable highlights that can be seen in the visualization:
Ethnicities congregate in clusters. In other words, your race/ethnicity is likely the same as that of your neighbors.
The presence of Hispanics is only majority in the Mission and one block in the Tenderloin (for those not familiar with the Bay Area, the Tenderloin is a notoriously bad neighborhood).
African Americans do not make up the majority population anywhere in SF except for Western Addition, and Bayview - Hunters Point, a landmark known for its decommissioned Shipyard.
Most places are dominated by white people, especially outside of urban areas.
Berkeley is mostly white, but the blocks surrounding UC Berkeley are Asian. Stanford, on the other hand, is more white.
West San Jose is white, while East San Jose is Hispanic. North and South San Jose are Asian.
The map also contains not only majority races but also total population numbers, densities (people per square meter) and percentages. I’ve also included income data. I encourage you to use the dropdown menu to play with the data.
I constantly come across people that claim Alexa (Amazon Echo) is spying on you. They argue that Alexa is either transcribing everything you say and sending the resulting plaintext to Amazon; or even worse, they are just recording and sending audio files.
I personally find it hard to believe. If Amazon is doing that, the reputational costs if caught would be huge. Furthermore, recording, storing, and extracting valuable information of such large amounts of data is a daunting task, even for a company like Amazon. Finally, many of those that complain about Alexa, happily carry a mobile phone at all times. Not only a phone follows you around almost 24/7, but they also come with many more sensors other than a microphone, such as cameras, and GPS.
In any case, I wanted to take a stab at figuring out if Alexa is really spying on us. Amazon has explained over and over, that although Alexa is actually listening at all times, something necessary to wake up upon the magic keyword “Alexa”, it only sends data to Amazon when such keyword has been heard.
How did I go about this?
One way to investigate this is to listen to the network packages that Alexa is sending. Unfortunately for us, we can’t see the actual package content, that’s encrypted. But we can still do something
If Alexa is really spying on us, there are two likely scenearios:
She could transcribe everything she listens to, and send the text over to Amazon.
Alexa performs audio recordings and the raw files that are sent to Amazon.
The major advantage of approach #1 is that text is very efficiently encoded and compressed, making its network transport easy to disguise and conceal. It also has a major drawback: sounds, such as a dog barking or foreign languagues cannot be easily transcribed, which means that Alexa would be deaf to these.
Approach #2 doesn’t suffer from this limitation, but at a great cost. Audio is relatively heavy, which makes it much more difficult to conceal than text.
In either case, I ran a small experiment:
During an 8-hour period of time when my home was empty, I set up my router to capture all outbound Alexa packages. During 4 of those 8 hours, I played a podcast in the background using a speaker connected to an old phone. During the remaining 4 hours, the house was silent.
The reasoning is simple, if Alexa is really spying on us, the network traffic would likely be different in the 4-hours where the house was silent versus the 4-hours where a podcast was playing in the background. In principle, we can assume that Alexa can’t differentiate a real conversation from the podcast being played, so she would send the text transcription or sound recording over to Amazon.
I used tcpdump running on my router to capture the packages, and parsed and plotted the results using Python:
Alexa total Kbytes sent per protocol under two scenarios: silence and podcast playing in background.
Discussion
As expected, no significant difference was found between silence, or podcast playing in the background when it came to Alexa network activity.
If Alexa is sending audio recordings, likely the UDP protocol is being used. However ~165Kbytes of data for a 4-hour audio recording are not nearly enough.
A similar reasoning can be made if we assume Alexa is sending plain text (likely sent over TCP). During those 4 hours, a professional speaker (~160 words per minute) would have spoken about ~38K words. In English, the average word is 4.79 letters, using a 7-bit encoding that would come to a total of ~82 Kb. tcpdump reported ~110 Kb of TCP traffic for those 4 hours. It’s possible but unlikely; TCP is also used for other types of traffic that needs to fit in those 110 Kb. Also, as explained above, text transcripts are limited to English; speaking Spanish would thwart Amazon’s evil spying plan.
Conclusion
Proving something is not happening is quite hard. In the light of these results, someone could argue: What if Alexa is throttling network traffic to not be discovered? What if Alexa is using a radio module and sending the results over AM frequencies instead of the Internet?
Sure, these are plausible scenarios, but they violate the Occam’s principle: the more assumptions you have to make, the more unlikely an explanation. My conclusion is that Alexa is not spying on me and that I will continue to use it at home as comfortably as I use my cell phone.
Final note
That Alexa is not spying on the general public is, with this data, probably true. However, I am also quite confident that Alexa could be enabled (remotely) to record and report everything to Amazon upon government request. This is just my opinion and I could be totally wrong.
I’ve been an avid DD-WRT user for about two years now, and I’ve decided to compile a list of the top 10 reasons for me to love it. If you want to get started on DD-WRT, you will need a compatible router and then you will need to flash it with DD-WRT.
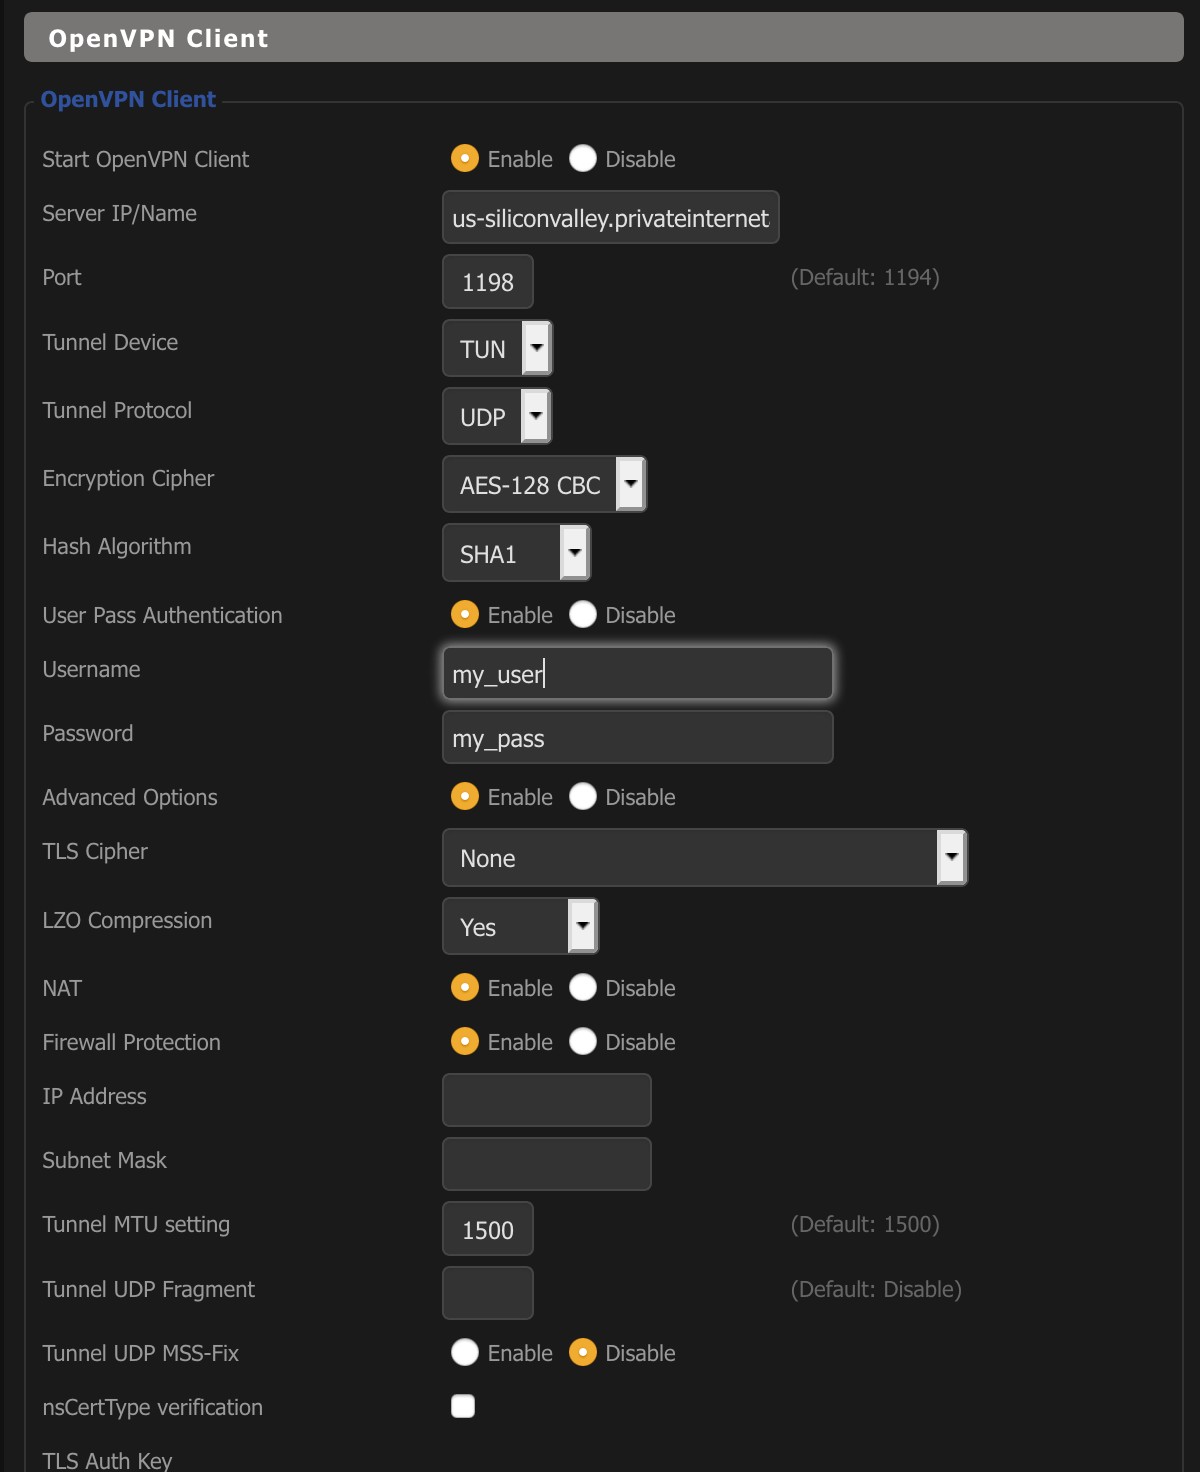
1 - VPN Client to encrypt all traffic leaving your home
Arguably the reason why I got started with DD-WRT. We live in a world where individuals, companies, and governments, can and do peek at your internet traffic and hold you accountable for anything that could be used against you. Examples of this are the famous love letters that Comcast sends their clients that are downloading movies, or the Chinese dissidents that are put in prison for complaining about the government.
Running a VPN client on DD-WRT couldn’t be easier. Most VPN providers give instructions on how to set it up. Running a VPN on your router is preferable to running it on individual devices, first, you have to only set up one device, not many. Secondly, it’s more secure, since it will protect us against IP leakage.
DD-WRT VPN Client Settings
2 - Access your local devices by URL
Conveniently you can assign names to devices at home. E.g my router is no longer 192.168.1.1, instead, I access router.hom.e, similarly my raspberry pi is rpi.hom.e. Before I would try to assign static IPs, and I will try to remember those.
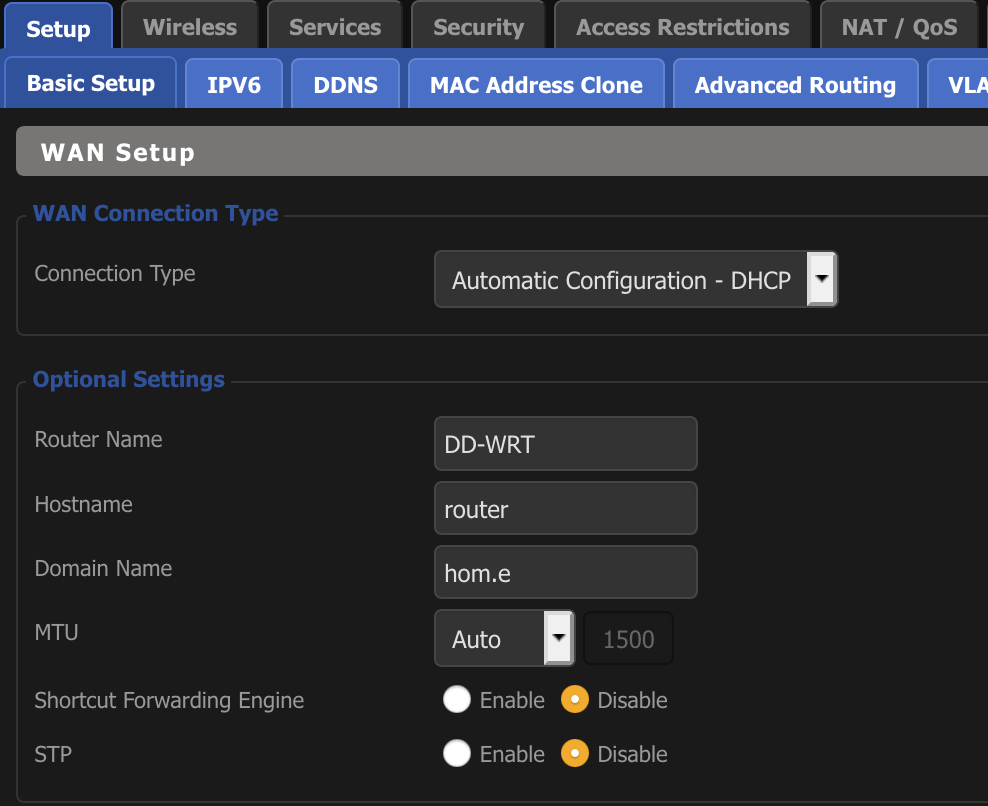
Setting this up is straightforward. First, create a domain name, I choose hom.e.
DD-WRT Domain Name Setting
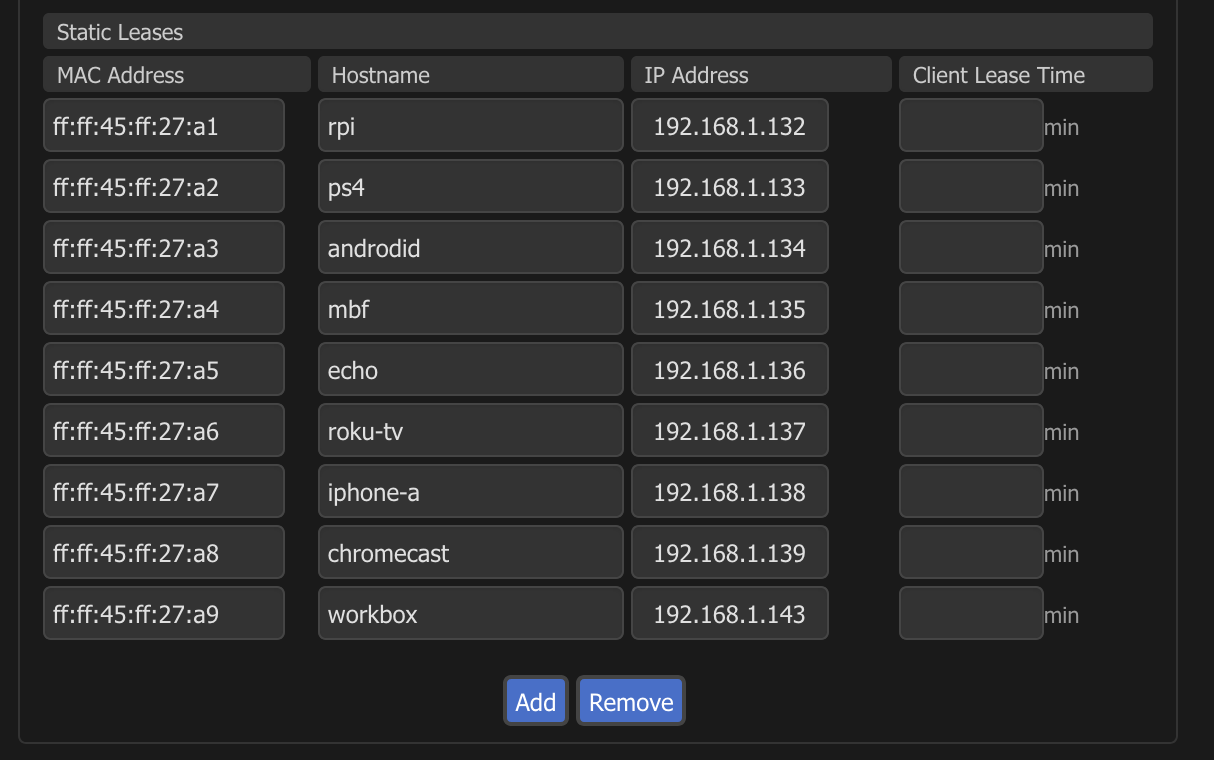
Then, find out the MAC address of each of your devices, and put that information into DD-WRT, as with this table.
DD-WRT Static Table
From now on, you will be able to access your devices by name.
3 - Run a VPN server to connect remotely
As the name indicates, running a VPN server on your router will allow you to connect to your home network when you are remote. This brings three main benefits: first, when using public networks your traffic is encrypted, secondly, if you are running advertising blocking on your router, you will also enjoy this feature, even when being remote. Finally, when paired with reason 7, your NAS will be available no matter where will you go. In other words, you could have a fully private 2TB “Dropbox on the cheap” no matter where you are.
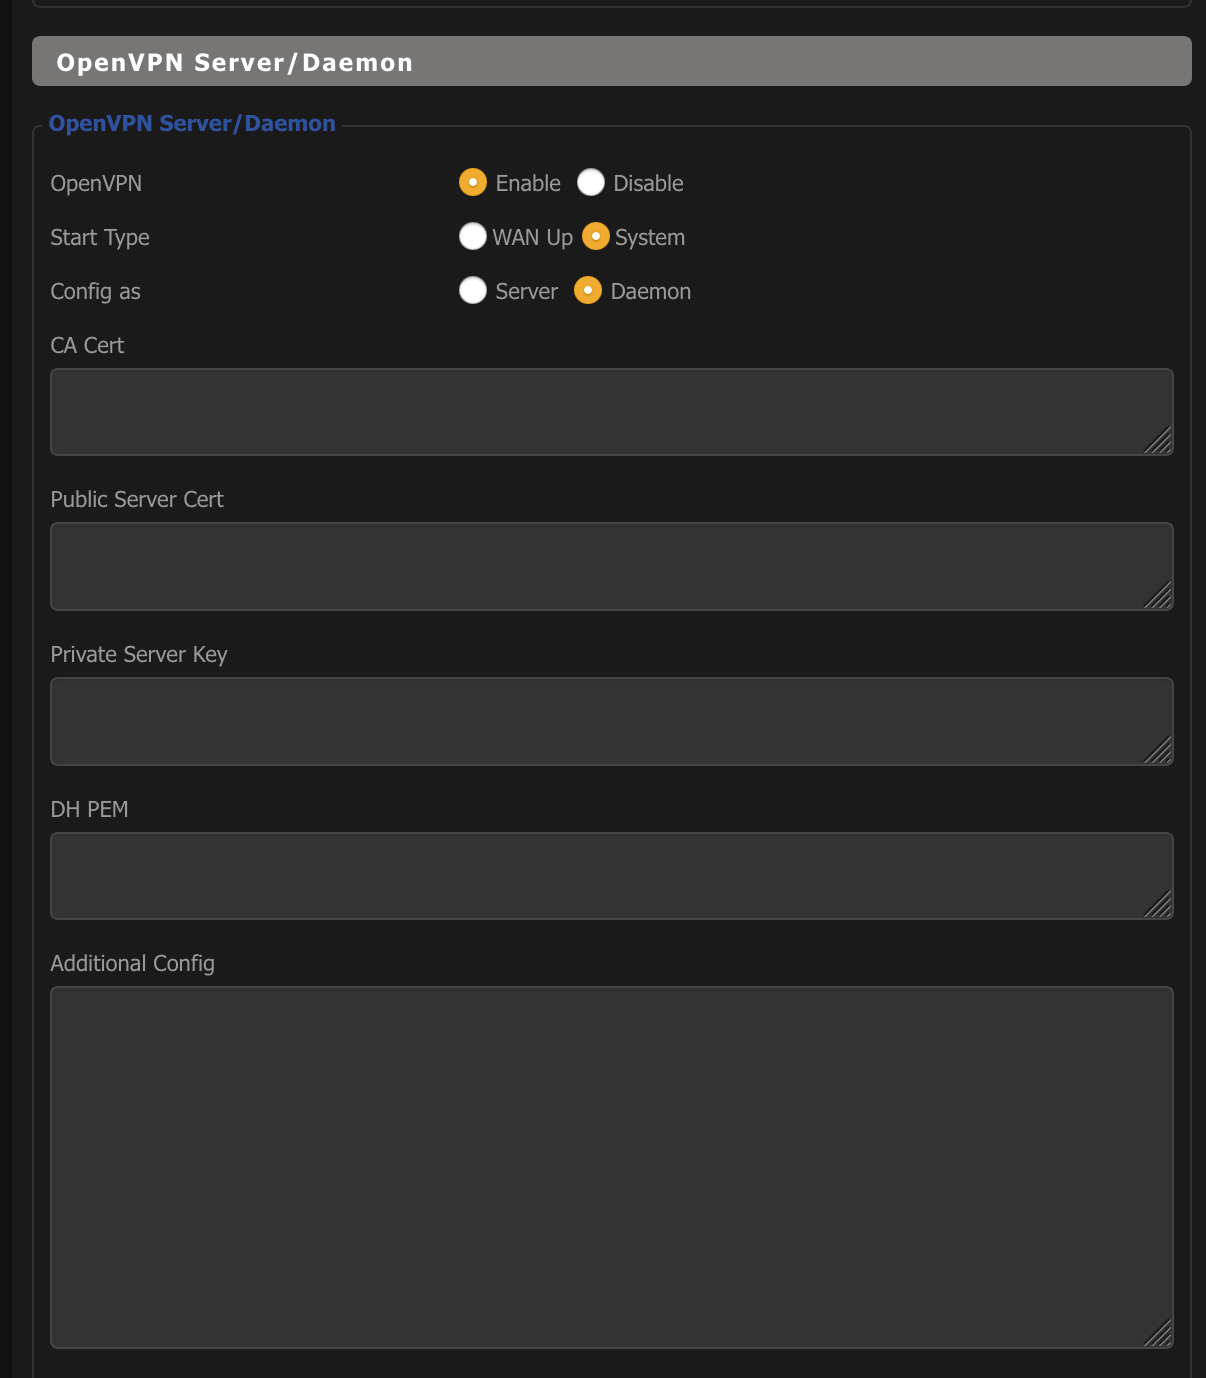
I personally run my VPN server on my raspberry pi. PiVPN makes it very easy to run a VPN server on your RPI, it will generate the DH, private and public keys, and it will also let you manage your user credentials. So if you have an RPI, I highly recommend going down this route.
Shall you choose to run your OpenVPN on your DD-WRT, you will need to generate the DH keys and the certificates yourself in another machine, and then input them in the UI.
DD-WRT OpenVPN Server
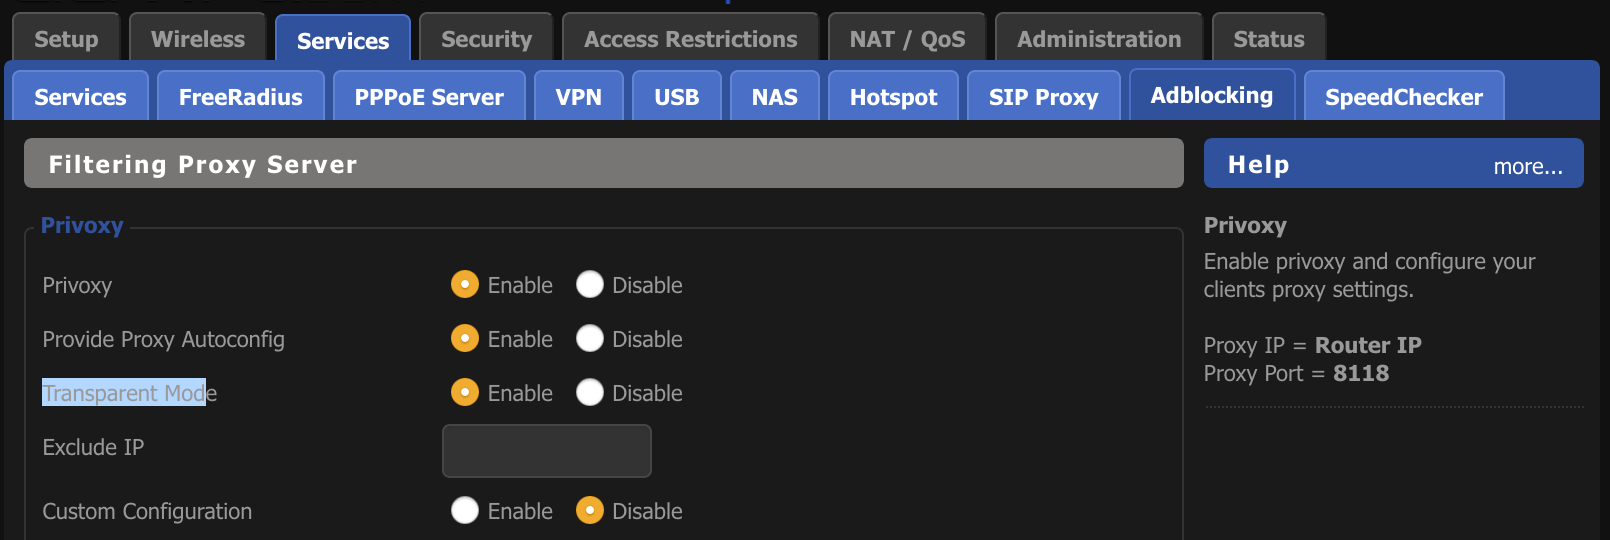
4 - Block advertising
Using privoxy we can filter advertising on all devices on our network. As with the VPN client, this is much more effective when done at the router level versus at the device level. DD-WRT comes with Privoxy, a fantastic project, and although the setup can get quite complicated, in it’s most basic form, it will filter a decent amount of junk and can run transparently.
To enable privoxy, head to Services -> Privoxy, and enable it there. This is how mine is looking:
DD-WRT Privoxy
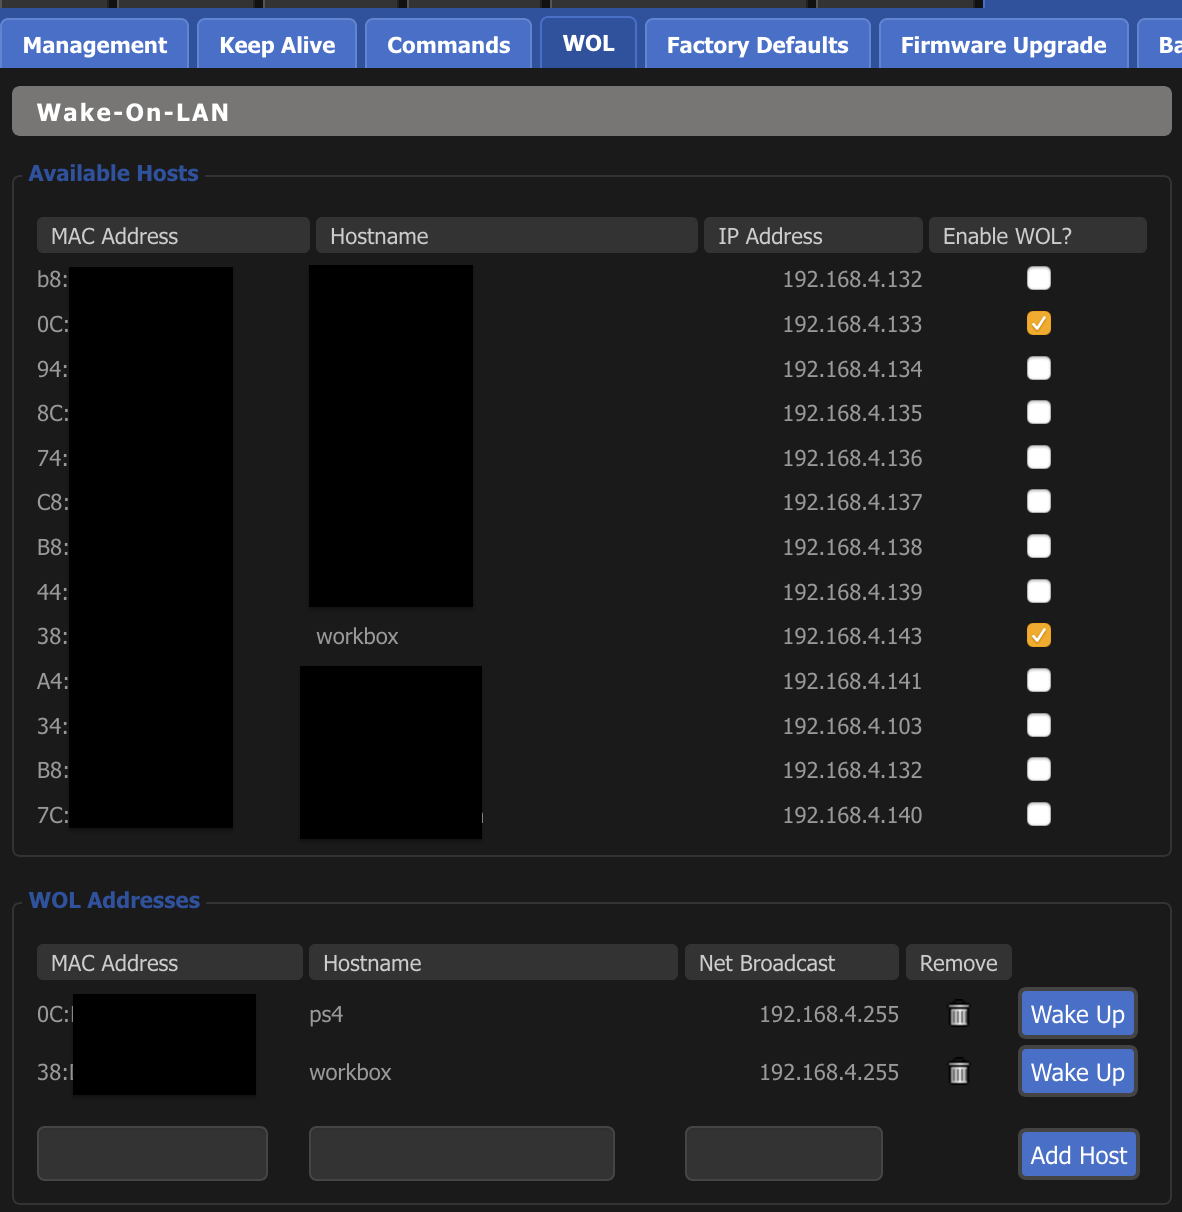
5 - Wake On LAN (WON)
Wake On LAN means that you can wake up a sleeping device from the DD-WRT web panel. I have a desktop computer at home that’s sleeping most of the time and that I access via Remote Desktop. This feature allows me to keep the computer sleeping with minimal power consumption, and to start it whenever I want from the DD-WRT dashboard.
To enable this feature, you need to set the operating system of the machine to go to sleep after say 2 hours of inactivity. You also need to tell the OS that the Ethernet card can wake up the computer. These settings vary across OSes, but I can point to this article if you are interested in enabling it.
Once enabled on the OS, in DD-WRT, you can enable WOL under Administration -> WOL. You’ll need the MAC address of the device you plan to wake with this feature. Something that you can find on the target machine, or on DD-WRT itself if said machine is already connected to it.
DD-WRT Wake On LAN
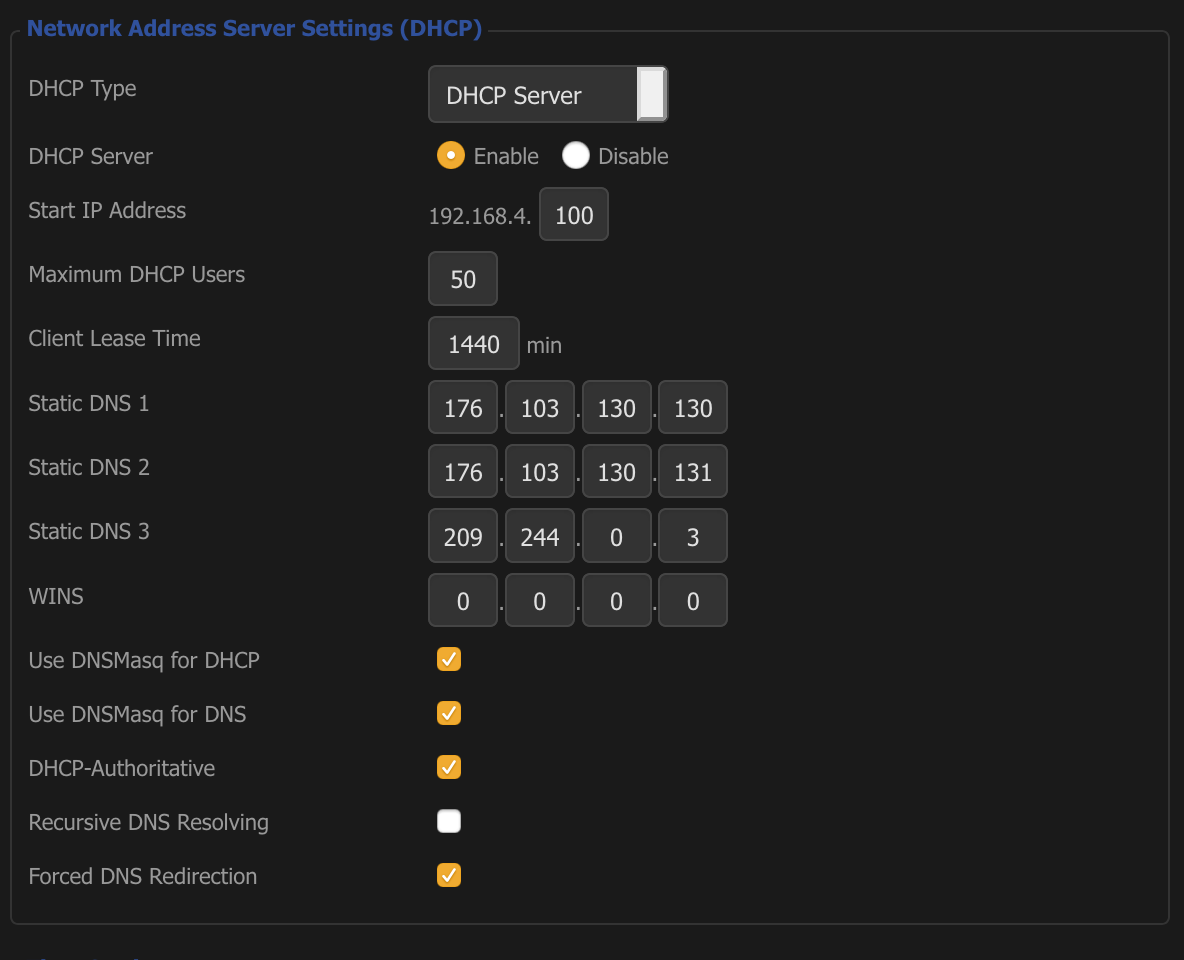
6 - OpenDNS or Level3 for DNS
This can easily be done with most other router’s software. Most people out there are using Google’s DNS, the infamous 8.8.8.8. Great performance, but, be aware that Google then knows which websites you are accessing. My suggestion is to use an alternative, and there are plenty: OpenDNS, the legendary Level3 or, Adguard.
I run the latter and couldn’t be happier. Their focus is on privacy, and as a bonus, they also block advertising by URL name. Setting up a DNS server is a matter of finding their IP, and putting them in the corresponding form.
In my case, I am using AdGuard and Level3 as a fallback. This is how my setup looks like.
DD-WRT DNS
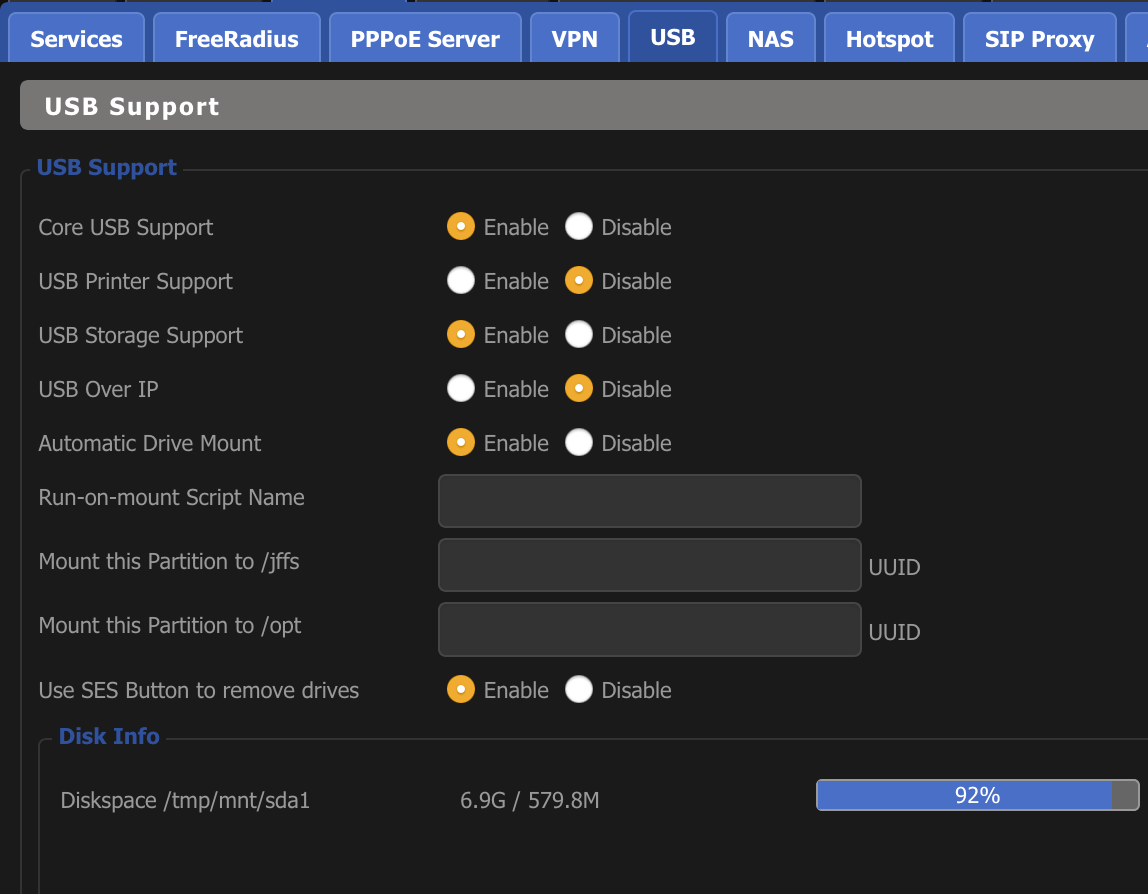
7- NAS
Again an extremely convenient feature. NAS stands for Network Attached Storage. Modern routers come with USB ports, some of them, even USB 3. This allows us to connect a USB drive to our router, and to then access it from any device in the local network. I use this all the time with videos, photos, and other documents.
To enable this feature, you first must enable USB support for DD-WRT. Head to Services -> USB, and there enable USB Core support.
DD-WRT USB Support
At this point, you can connect your USB drive to your router, and if it’s formatted in a compatible filesystem (I recommend ext4), it will be mounted automatically.
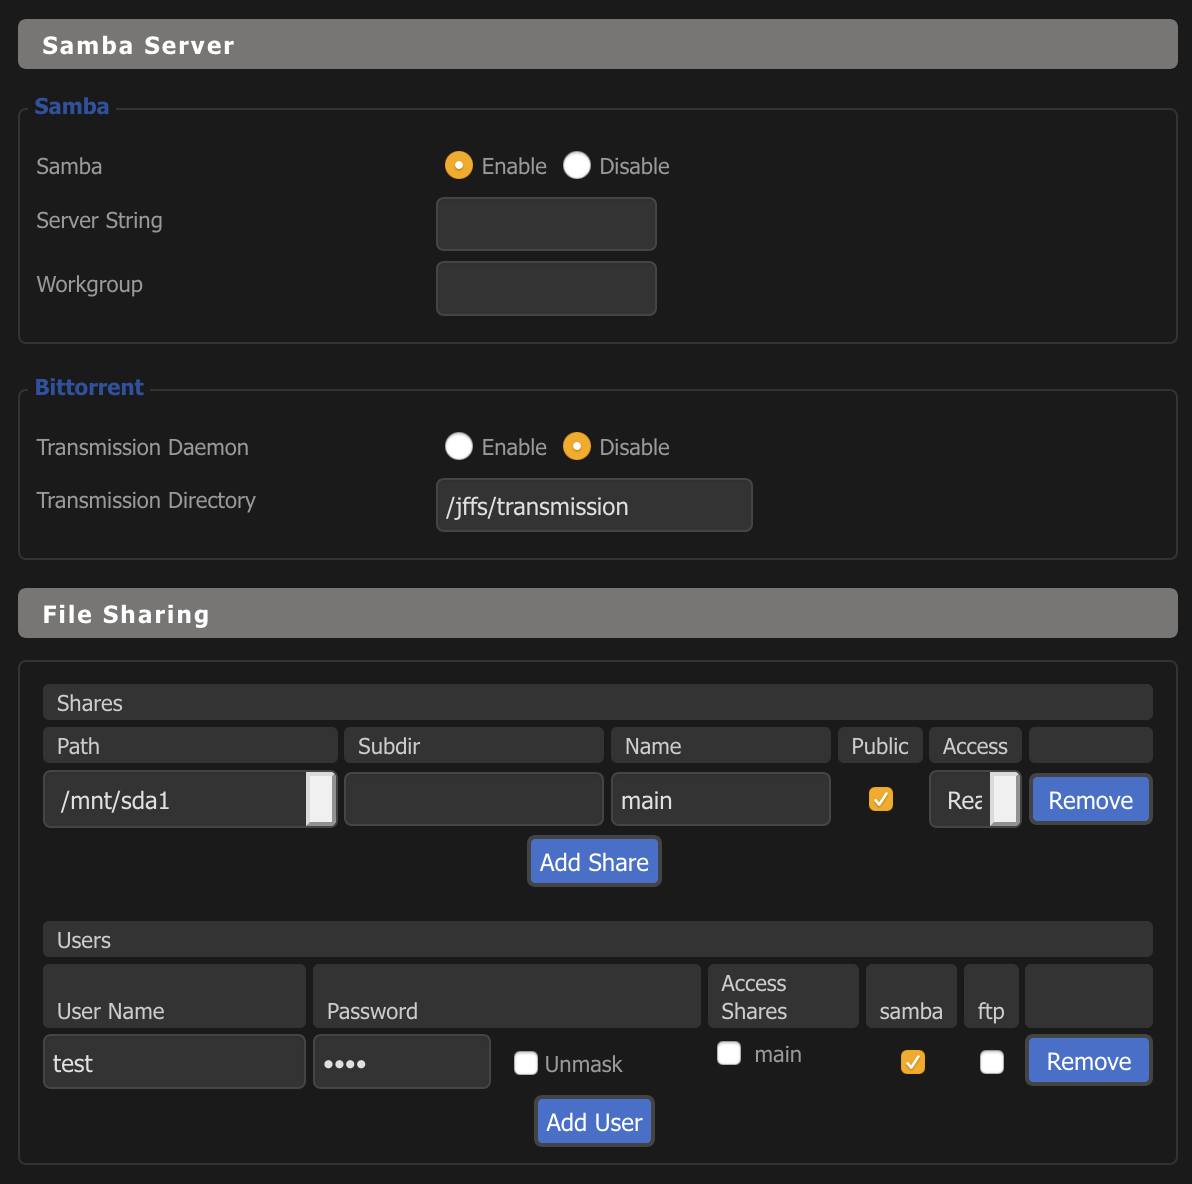
Then head over to Service -> NAS, and enable Samba. Last part before we are done is to create a username and password, and you do that under the File Sharing tab. Make sure you enable the ‘samba’ check.
DD-WRT Samba Support
Now you can access your files from any device in your local network.
8 - tcpdump
tcpdump is a very useful UNIX command that can monitor TCP and UDP packages that a device is receiving and sending. This can be used for debugging purposes on your local computer.
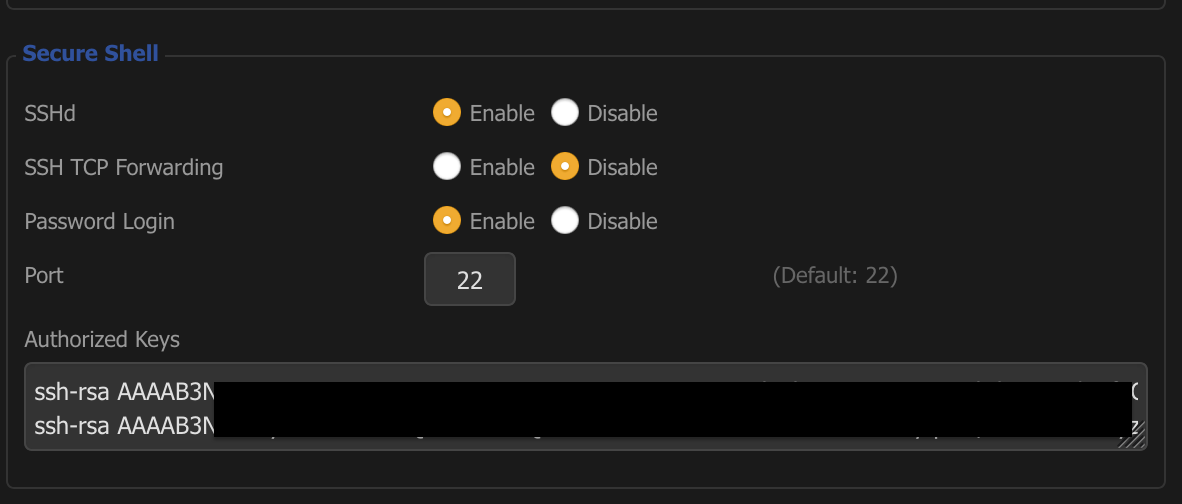
The great part of running tcpdump in your router is that you can see all traffic from any device in your network since all devices are connected to the router. To run tcpdump in your router you will need to first SSH into it. To enable SSH in your router, go to Services -> Services, and there you will see an SSH section, like this one.
DD-WRT SSH
In the Authorized Keys section, add the public SSH keys of the device(s) you will use to access the router. Then, you should be able to run something like ssh [email protected]
9 - Bandwidth monitoring
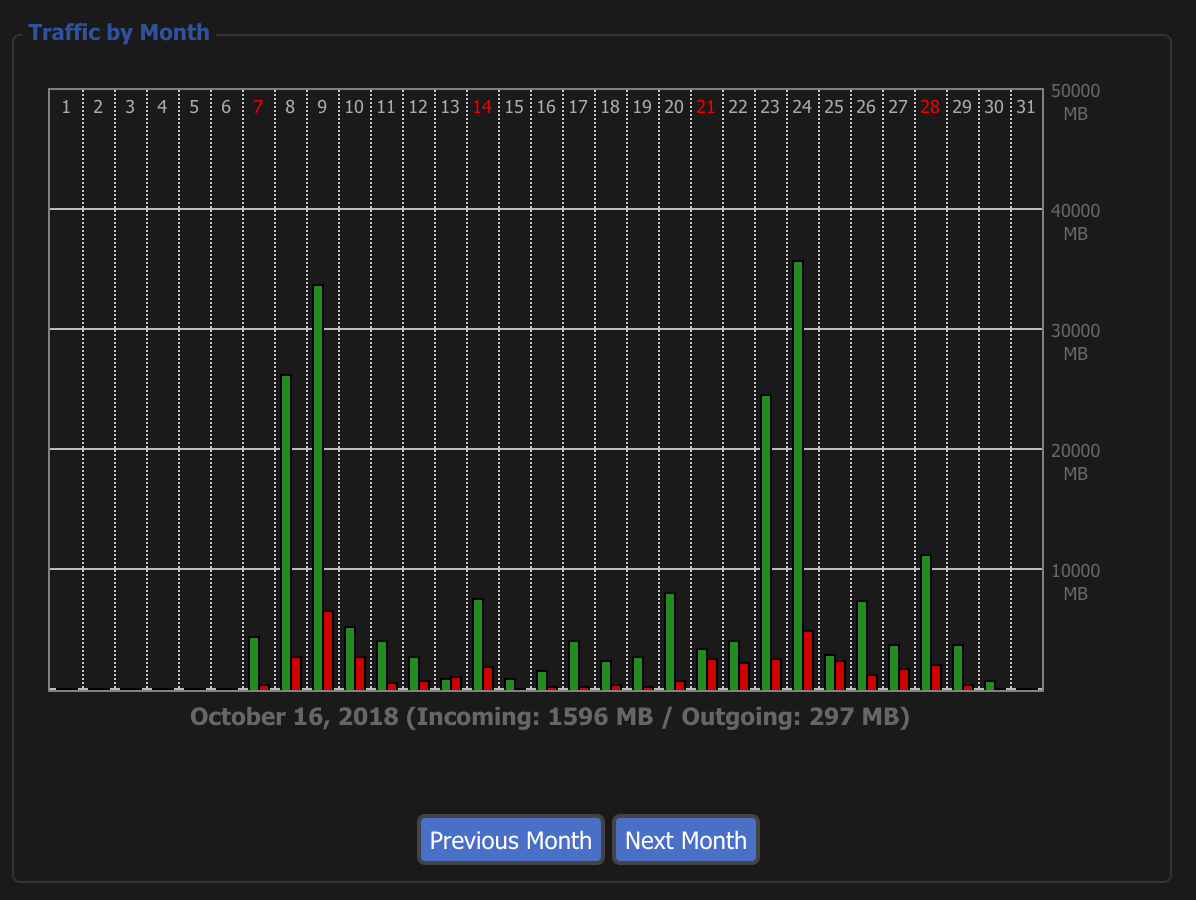
Since some companies (cough.. Comcast.. cough) are now measuring the GBytes you download and charging you for it if you go above. It is important to keep an eye on usage, especially for download heavy users. DD-WRT automatically aggregates this kind of data for you, and it’s available under Status -> WAN.
This is how my usage looks over the last month.
DD-WRT Bandwidth Usage
10 - QoS
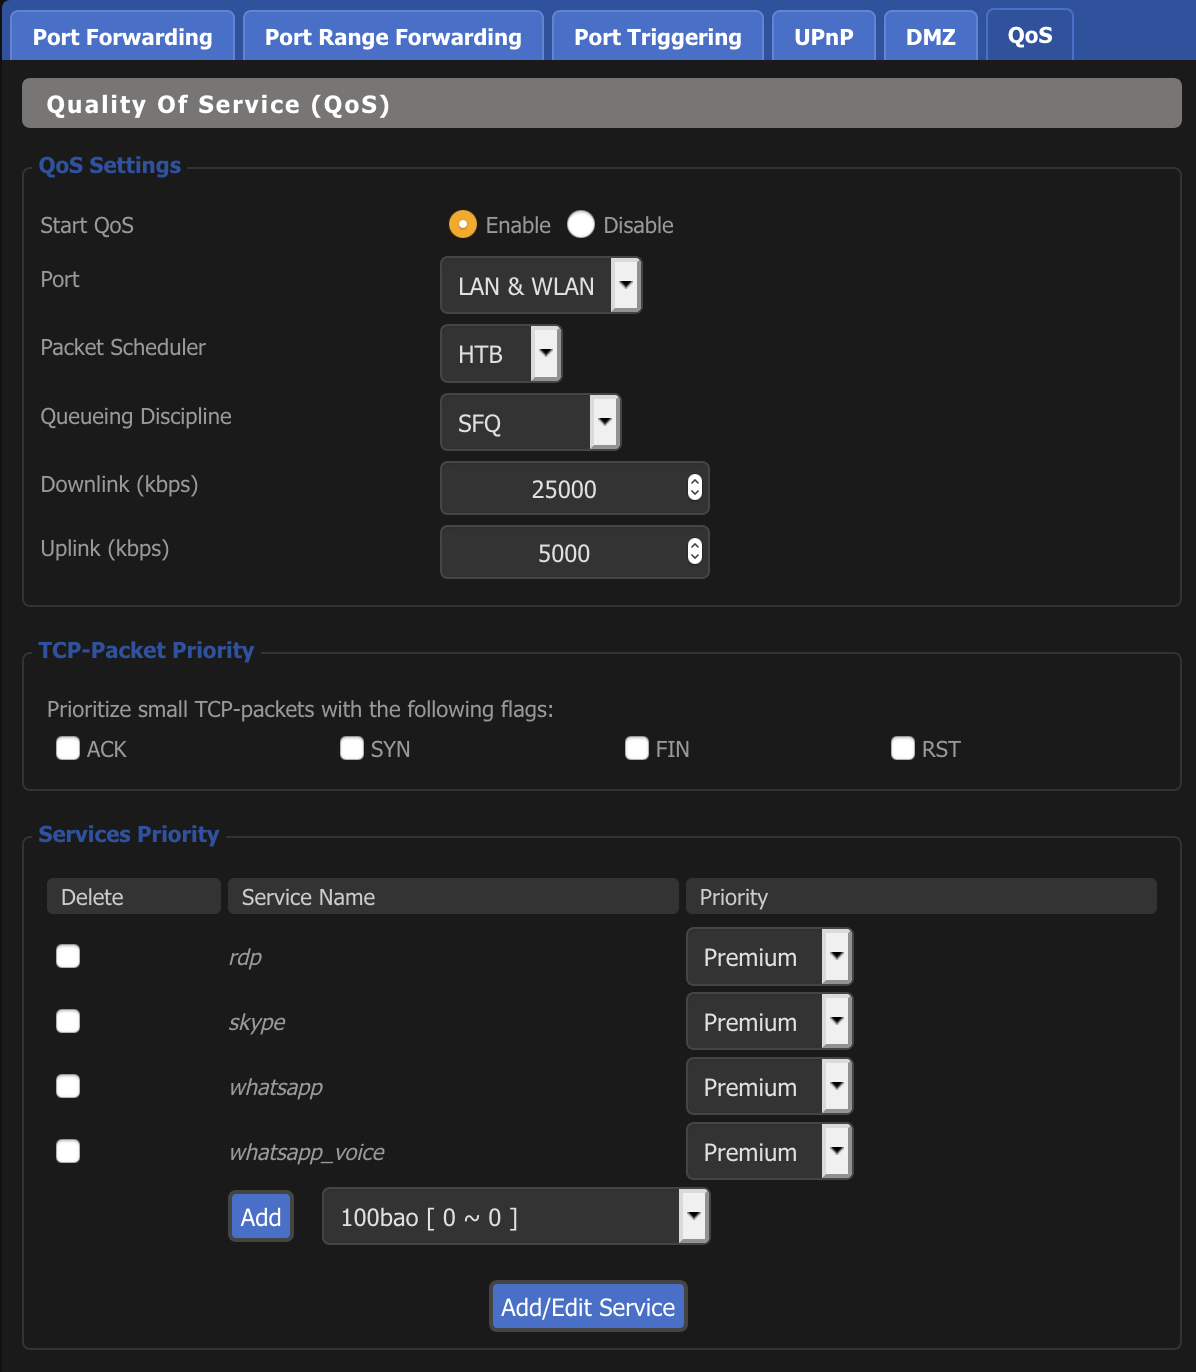
My last reason for choosing DD-WRT is QoS (Quality of Service). This feature tells the router to prioritize certain types of traffic over the rest. In a typical home, we have dozens of devices connected, and it’s not uncommon for someone to be streaming YouTube, while another person is trying to call a friend over Skype. Under this scenario, it makes more sense to prioritize Skype over YouTube, since YouTube can buffer and Skype cannot.
To set up QoS, go to NAT/QoS -> QoS. There is a checkbox for enabling QoS, and also a form to select the services you want to prioritize. In my case, I use Skype, WhatsApp and Remote Desktop (RDP) quite often, and these applications would benefit from improved latency.
I learned today that a somewhat undocumented feature of Mac OS allows users to backup to any NAS, and not just AirPort or NAS with the Apple Filesystem.
The reasons this is interesting is because, first, AirPort has been discontinued, so it’s no longer an option. Secondly, I’ve tried running a NAS formatted as HFS+ on my Raspberry Pi from guides like this. Unfortunately, in my experience, HFS+ support on Linux is not great, and if the device wasn’t properly unmounted (e.g. a power outage), the filesystem would get corrupted and couldn’t be fixed.
The solution I bring you today is compatible with EXT4, the native filesystem for Raspbian (Debian).
My setup
I have a raspberry pi (RPi) that’s connected to my router via Ethernet, and also connected to two 2TB hard drives.
The RPi, among other things, is running Samba, that allows any client on the local network to access any file on those USB drives. Pretty convenient to stream videos, etc.
Two 2Tb USB drives connected to Raspberry Pi, and RPi herself connected to Netgear home router. Note the hard drives are fed by a USB power rack.
Turning an EXT4 NAS Time Machine capable
On the Raspberry Pi
I am assuming your USB drive is already mounted and you can access it from another device on the network using samba. If that’s not your case, I can recommend this guide.
With that done, last part is to install Netatalk. Netatalk is included on the standard Raspbian package repository, but the version there is too old; so instead, we are going to compile the latest version available.
First off, install the system dependencies that will let you compile netatalk:
Then, head out to http://netatalk.sourceforge.net/, and check their latest version. As of the time of writing this 3.1.11. Let’s download it, compile and install it.
Open your terminal, and issue the commands:
$ wget http://prdownloads.sourceforge.net/netatalk/netatalk-3.1.11.tar.gz
$ tar -xf netatalk-3.1.11.tar.gz $ cd netatalk-3.1.11
$ ./configure \
  --with-init-style=debian-systemd \
  --without-libevent \
  --without-tdb \
  --with-cracklib \
  --enable-krbV-uam \
  --with-pam-confdir=/etc/pam.d \
  --with-dbus-daemon=/usr/bin/dbus-daemon \
  --with-dbus-sysconf-dir=/etc/dbus-1/system.d \
  --with-tracker-pkgconfig-version=1.0
$ make
$ sudo make install
$ netatalk -V
If that latest command succeeds, you got it! ???? Last part is to configure Netatalk. We are going to edit three configuration files.
First, make sure that the content of /etc/nsswitch.conf is like this:
# /etc/nsswitch.conf Example configuration of GNU Name Service Switch functionality. If you have the glibc-doc-reference' andinfo' packages installed, try: `info libc "Name Service Switch"' for information about this file.
passwd: compat
group: compat
shadow: compat
gshadow: files
hosts: files mdns4_minimal [NOTFOUND=return] dns mdns4 mdns
networks: files
protocols: db files
services: db files
ethers: db files
rpc: db files
netgroup: nis
Secondly, edit /etc/avahi/services/afpd.service with your editor. It’s content should be:
After running this command, head to your Time Machine preferences. Once there, go to Select Disk, your NAS should be selectable:
After that, the first backup should complete. It will probably take a long time (4+ hours). My advice is to leave your Mac plugged overnight, with the screen off, and to check the next morning. After that, new backups are incremental, hence small in size and much faster.
Give your self a pat in the back, your Mac will now back up on its own at everyone opportunity it gets on your NAS.
Also, very important that if you plan to run this 24/7, as I do, I can’t recommend enough getting a USB Power Hub with an external power supply. Hard drives have high peak demands that the RPi will most likely not be able to meet, with its simple power control unit, this will lead to a courrupt file system.
I simulated millions of single deck blackjack games, tracking which hands are more common. Using D3.js for plotting, the results look like this:
An interactive version that shows the exact probability for each of the outcomes is available here. Apologies about using iframe, if you have a better way of embedding HTML+JS on a WordPress page, I am listening.
To see it in full-screen, visit: https://d3b0pbm0wpsemh.cloudfront.net/
Using Python’s Numpy is easy to draw how an average Chinese character would look like. I took the 2000 most common characters hanzidb.org, drew them onto images using `PIL` and calculated it’s average with Numpy.
While I can’t read a single word of Chinese, this is what struck me the most:
There are four main lines: top, bottom, middle, and left.
The bottom line increases in intensity towards the right, likely a remanence of Chinese being a brush script.
The darkest area occurs at the middle bottom.
We can appreciate a few short strokes on the left top side.
If you have any other insights or ideas send us a comment!
I am sure you are familiar with the basic strategy of Blackjack. A diagram with the dealers face up card on the x-axis and the player cards on the y-axis. In each cell, the optimal strategy is shown, usually color coded to make it easier to remember. This is an example of such diagram from basicstrategycards.com:
Basic strategy chart
How these are created is no secret, for each combination and strategy, thousands of hands are simulated by a computer. When we have collected enough samples, we can pick which strategy works best for a given combination.
I wanted to replicate the work necessary to create such graph; first as a technical challenge, as it turns out is not as simple as it may seem, and secondly to get a more detailed view of the odds. These readily available diagrams are hidding a lot of information, for the optimal strategy for a pair of Kings is to stand but how much worse off are we shall we choose to hit? Also, they are making a big simplification by only looking at total scores e.g. an 11 should double against a 2, regardless of how that 11 came to be: 2+9, 3+8, 4+7, etc.
Code
I spent some time writing a blackjack odds simulator in Python and C, this latter for efficiency reasons, and I published all code in Github.
Python
Python is my go-to languague, and this project is no exception. I wrote classes for cards, decks, and blackjack games using the very pythonic __getattr__, __le__, __unicode__, etc. The result is quite readable, but amazingly slow to execute.
The code does a couple of things, first, it generates all valid card combinations for the player. Valid shall be understood as any card combination with a score of 20 or less, 21 is still valid game state, but you have no option but to stay when you reach 21. Fun fact, there are more than 60.000 different valid card combinations in a single deck blackjack game! From 2-2, all the way to 2-2-2-2-3-3-A-A-A-A.
Secondly, for each of these valid game states, we simulate a few hundred random games, and store the results in a dictionary.
The main caveat is how slow the code executes, I tried using multhreading and multiprocessing techniques to no avail. The bottleneck are the list operations that often result in copying large objects from a memory section to another.
C to the rescue
If you need performance, bring C into your party. It compiles directly into assembly, that is, native CPU instructions, and it forces you think about the underlying memory structures.
I wrote similar code in C to the one in the previous Python section. I didn’t write the part that generates all valid card hands in C since that executes decently fast in Python, instead I wrote the part that runs a few hundred or thousand simulations for each valid hand. In C, the equivalent code runs about 3 orders of magnitude faster. This is a bit of an unfair comparaison, since the code I wrote in C makes an explicit effort to minimize memory footprint, but it is much faster nonetheless.
I can think of a few visualizations, but one I am particularly curious about, is seeing the odds for the different strategies for a given hand.
Using D3.js, I created a heatmap with the player hand in the Y-axis, and the dealers face up card in the X-axis. For the color of each cell, I used the Lab color space, which has a luminosity component that is constant, and two independednt components, A, and B. In my case, I mapped A to the probability of winning if standing, and B to the probability of winning if hitting. I chose this color space versus classical RGB, because of the nonlinearities of the human eye, i.e. two colors could be perceived as being very similar yet be very appart in the RGB color space. Such thing is not possible in the Lab color space.
Click on a box to drill down on the simulation levels:
I thought today while watching England vs. Tunisia that soccer players look very much alike, especially within a team, and so I thought I could compute the average face by soccer team for this world cup.
Data
Getting the data, in this case, images for each player in the current soccer world cup is arguably critical. The images need to have a plain background, similar illumination, and ideally, equal size. Luckily, the FIFA has done all of this, and the images are available online: https://www.fifa.com/worldcup/players/
If you inspect one of the player’s elements, you can access the URL for the player’s image, which can then be downloaded programmatically.
Inspecting the player element on the browser console shows the URL.
I extracted the page’s source code, and downloaded the 736 300 by 300 pixels images corresponding to all players in the world cup (32 teams by 23 player per team = 736).
Averaging a face
Average face is a loosely defined term; a naive implementation could be to treat the images as numerical matrices and use NumPy to average their value. This is only a few lines of code:
import numpy as np
import imageio
countries = ['argentina', 'belgium', 'colombia', 'croatia', ...]
for country in countries:
    images_stacked = np.zeros((23, 300, 300, 3))
    for i in range(0, 23):
        images_stacked[i] = imageio.imread('images-input/%s/%s_%s.jpg' % (country, country, i))
    results = np.zeros((300, 300, 3))
    for color in range(0, images_stacked.shape[3]):
        for x_pos in range(0, images_stacked.shape[1]):
            for y_pos in range(0, images_stacked.shape[2]):
                results[x_pos, y_pos, color] = np.mean(images_stacked[:, x_pos, y_pos, color])
    imageio.imwrite('images-output/%s_naive_averager.png' % country, results)
There is room for improving on this code, but I am not interested in that, rather on the actual results. And here is how they show:
Sweden Naive Average Face
Let’s look at another example:
Brazil Naive Average Face
Even though images are standard, averaging the pixel values doesn’t build a compelling picture; sure, we can distinguish some features such as color of the t-shirt or hair, but we can’t “put a face to it”. We need to think of something else…
Face morpher
Of course there is a better way, meet Face Morpher (FM from now own). FM works in a different way to find the average face, instead of averaging the pixel values, it builds a geometry of the face by identifying elements on it, such as the eyes or cheeks. It then proceeds to average those sections across images.
The results are much more compelling, and we are definitely able to put a face to this teams now.
Sweden FM Average Face
Or in the case of Brazil:
Brazil FM Average Face
It looks great! And yet, aren’t we missing important and distinctive elements, such as the hair, ears, or even team t-shirt?
Face art
I decided to them combine the two images: naive + FM for a more compelling result. I blended the images using Sketch, the naive average serves as background, and overlayed on top a semi-transparent FM face.
Quite happy with the result:
World Cup 2018 Average Player Face by Team
Extra
How does the average face look across all countries then?
Average face across all countries
Congratulations to France ???????? on this World Cup, and hope you had fun watching the games and reading through this visualization. Comment if you like!
I contacted support, and they said that the billing address from my credit card does not match my profile’s address. You’ve heard correctly, Sony thinks that your address should be the same as your billing address in all cases, otherwise, purchases will fail with that cryptic error.
After a while, this error came back, and I spoke again with PSN support about it. After my two interactions with Sony, and the several comments and many visits this post has received, it has become obvious that Sony’s PSN is a very inmature product with many known bugs. This error seems to be a generic error message that can come from many underlying circumstances.
While Sony’s PSN get their act together, if you are getting this error, my suggestion, and unbelievably the solution proposed by Sony’s support themselves, is to head onto eBay or Amazon, and to buy a gift card, or digital code for your game.
This API can parse, format and find phone numbers in text documents for any phone number worldwide.
These are the endpoints:
Endpoint /parse
Given a phone number with an international prefix, or if you prefer by specifying the ISO country code, and the national phone number instead, we can tell you:
number_type: One of the following: FIXED, MOBILE, VOIP, SHORT_NUMBER, PREMIUM, TOLL_FREE, PAGER, etc.
location: Where available by prefix.
phone_number_e164: Phone number in E164. Perfect to be saved in a database in a standard way.
carrier: In countries where blocks of numbers are assigned to carriers. Note that if portability is available in the country, we will return the original carrier.
is_valid_number: Using the length, format and prefixes against our 100Mbytes+ database of phone numbers we can asses the validity of the phones. E.g. we can detect fake US numbers if the prefixes don’t exist.
country_code_iso: Two letter ISO country code for the phone number.
We also give other auxiliary fields such as: number_of_leading_zeros,national_number, etc. If you need more information returned, contact us!
Given a phone number with an international prefix, or if you prefer by specifying the ISO country code, and the national phone number instead, we can tell you:
national: phone number in national format, e.g. (415) 498-8739
international: phone number in international format, e.g. +1 (415) 498-8739
E164: phone number in E164 format, e.g. +14154988739
RFC3966: phone number in E164 format, e.g. tel:+14154988739
Given a text document (max. 512 characters), we can find all phone numbers in it. E.g. for the text: Hey, the office's phone number is (510) 765-9845, my personal one is 4157653478. We will return the begin and end character position for both phone numbers, along with a E164 formatted version of each. We can find phone numbers, even if the format used in the document differs.
curl -X POST --include 'https://f-sm-jorquera-phone-insights-v1.p.mashape.com/find-numbers-in-text' \
  -H 'X-Mashape-Key: {my-mashape-key}' \
  -H 'Content-Type: application/json' \
  -H 'Accept: application/json' \
  --data-binary '{"text":"Hello, call me at 4154785647 or at (510) 675 8976 if its after 11PM","country_code":"US"}'


 not spying on you")


