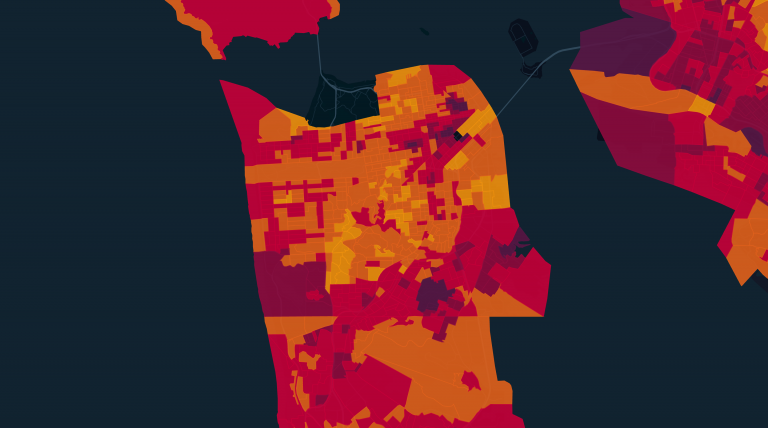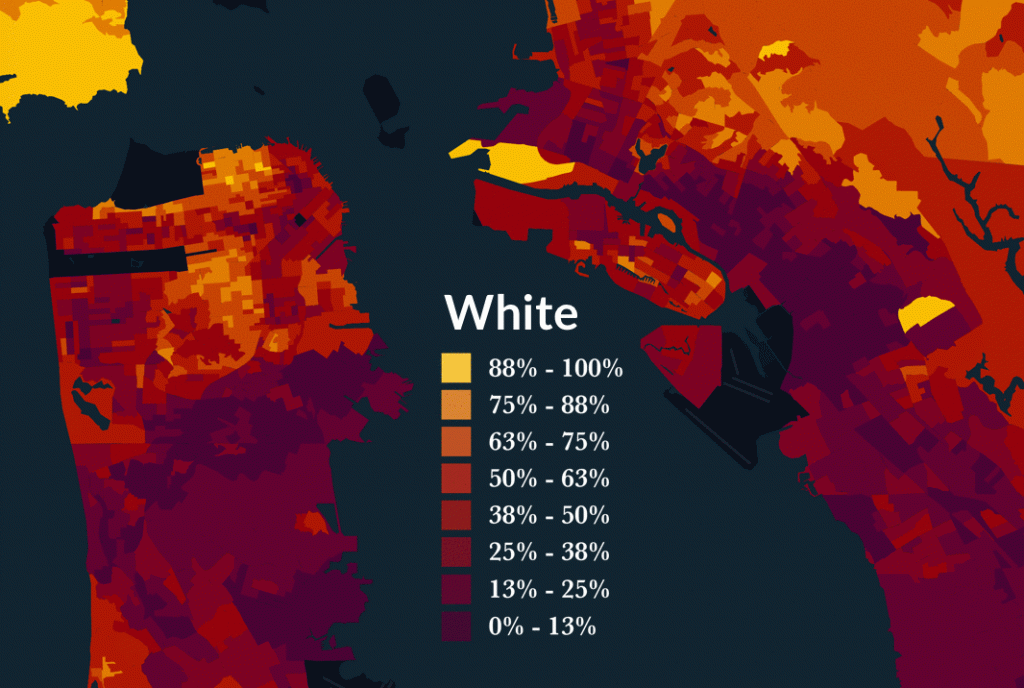
I had been wanting to better understand the geographical characteristics of race and ethnicity in the San Francisco/Bay Area region where I reside. The US Census has plenty of updated information on this topic, and Uber recently released Kepler.gl, an in-browser application to visualize maps. With both of these, it was relatively easy to build this interactive map.
By default, you are seeing the majoritarian race that populates each census block (geographical areas containing anywhere from 2,000 to 8,000 people). I grabbed the data from the American Community Survey in its most recent 2017 version. Note that the US Census recognizes 5 different races: White, Asian, African, Pacific Islander, and Native American, and 2 ethnicities: hispanic or non-hispanic.
In my humble opinion, the way the races and ethnicities are classified in this survey could use some work. So, for my visualization, I combined all self-reported hispanics regardless of their reported race and made up a new race “hispanic” with these individuals. For consistency, results for other races only account for individuals that also self-reported their ethnicity as non-hispanic.
A few notable highlights that can be seen in the visualization:
- Ethnicities congregate in clusters. In other words, your race/ethnicity is likely the same as that of your neighbors.
- The presence of Hispanics is only majority in the Mission and one block in the Tenderloin (for those not familiar with the Bay Area, the Tenderloin is a notoriously bad neighborhood).
- African Americans do not make up the majority population anywhere in SF except for Western Addition, and Bayview – Hunters Point, a landmark known for its decommissioned Shipyard.
- Most places are dominated by white people, especially outside of urban areas.
- Berkeley is mostly white, but the blocks surrounding UC Berkeley are Asian. Stanford, on the other hand, is more white.
- West San Jose is white, while East San Jose is Hispanic. North and South San Jose are Asian.
The map also contains not only majority races but also total population numbers, densities (people per square meter) and percentages. I’ve also included income data. I encourage you to use the dropdown menu to play with the data.
Comment and share if you liked this! For a full-screen view, go to: https://fsanmartin-co-geo-ethniticies-public.s3-us-west-1.amazonaws.com/geo-ethnicity.html
